STEP 1: Identify scoring areas: Where does my team shoot the ball well?
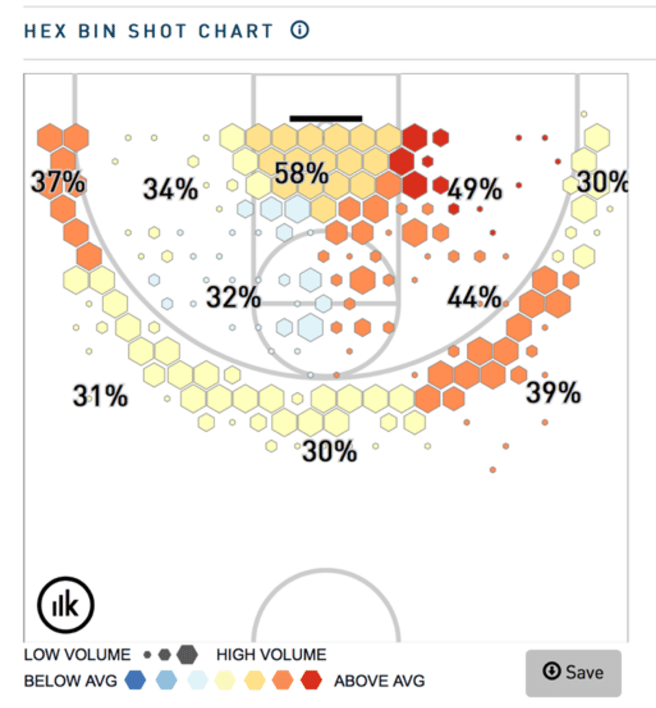
Scoring areas are the locations on the court where a team shoots a high-percentage. Specifically, a team’s scoring areas are the locations on the court where they score at least 1 point per shot. To calculate points per shot just multiply the percentage by the value of the shot. For example, if a team shoots 40% from three point range, that is 1.2 points per shot (.40 x 3). To determine your team’s scoring areas, you can use the Hex Bin shot chart provided by Krossover Insights. From this chart, a coach can see all the locations their team shoots from on the court and how well they shoot from those locations. To read the chart, look at the size of the hexagon to see how often your team shoots from the spot and then look at the color of the hexagon to see if your team shoots better than average from the spot. Put simply, the bigger the hexagon, the more shots are being taken from the position and the darker the Hexagon, the more likely the team is to make the shot.  For example, in the above chart, we look for dark hexagons to see where this team shoots well. This team is above average from the left baseline (dark orange hexagons), right wing from three-point distance (dark orange hexagons), and from the right side mid-range and within five feet (red, dark orange, and light orange hexagons). These areas are the team’s “scoring areas”. Schedule your free demo now and get 10% discount on your order… After looking at the Hex Bin shot chart, we know several vital pieces of information about this team’s offense. We know that for this team to be successful on the offensive end, it should focus on attacking the basket and finishing around the rim, shooting mid-range shots on the right side, and shooting three point shots from the right wing and left corner. Also, we can tell that this team shoots too much from areas where they are average to below average shooters. Their midrange shots from the left side are below average, and their shots from top of the key, left wing, and right baseline from three point range are below average. For this team to be successful offensively, they need to focus on their scoring areas and limit the shots where they are below average shooters.
STEP 2: What types of shots should my team take?
Shot Zone and Shot Creation Type
From the Hex Bin Shot Chart we can tell where on the floor our team should shoot. Now we need to determine what kind of shots we should be taking. For this, Insights provides the “Shot Zone” and “Shot Creation Type”. These are powerful tools because, used together, we can identify what types of shots are best for our team.  Keeping with the example of the team in the Hex Bin Shot chart, first we click on the three point area on the “Shot Zone” and Insights automatically breaks down the type of shot in the “Shot Creation Type”. This shows us what percentage of shots are made based on what type of shot is taken. For example, overall the team in the example shoots 34% from three point range. However, we can click on “Shot Creation Type” to see how well the team shoots catch-and-shoot jumpers from three point range versus off-the-dribble jumpers. In this example, the team shoots 20% on off-the-dribble three point attempts and 38% on catch-and-shoot attempts. This information tells the coach that their team should focus on catch-and-shoot three point shots and avoid any off the dribble attempts. In addition, Insights provides a look at where each type of shot is successful. When you select a type of shot on the “Shot Creation Type”, the Hex Bin Shot chart adjusts to reflect where the shots were taken on the floor and what the shooting percent is for each shot. For example, here is a look at the team in the example’s mid-range pull up jump shots.
  This is valuable information. Just looking at the team’s overall mid-range jumpers percentage on the overall Hex Bin Shot Chart, it looks like this team should shy away from mid-range jumpers (under 1 point per shot). However, by using Insights to break down mid-range jumpers by shot type, we can see that pull-up jumpers from the right side is a good shot for the team.
STEP 3: Putting it all together
Once we have identified the team’s scoring areas (Step 1) and the best shot type for each scoring area (Step 2), we can then determine where and how the team should shoot. Just make a list of the best shots for your team according to the highest points per shot. The best shots for the example team are:
Layups (58% x 2= 1.16 points per shot) Catch-and-shoot 3s from right wing and left baseline (38% x 3 = 1.14 points per shot) Off the dribble mid-range jumpers from the right side (52% x 2 = 1.04 points per shot)
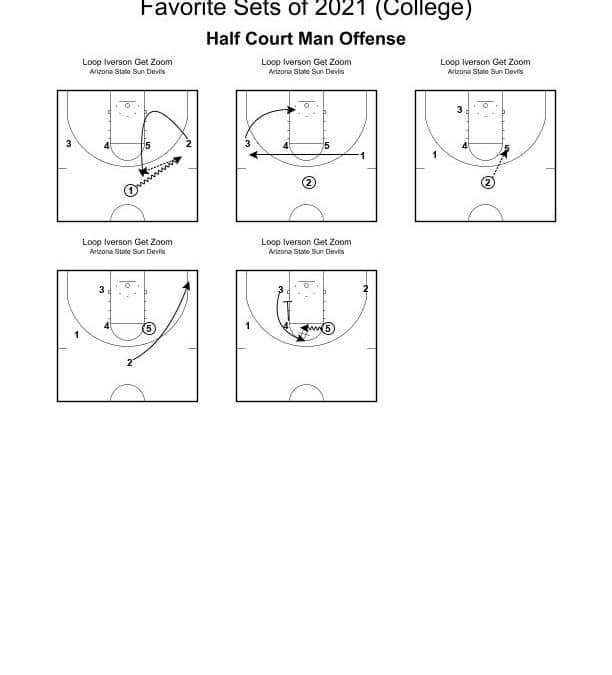
Put simply, the example team scores when they attack the rim and look to finish around the basket, get catch-and-shoot threes from the right wing and left baseline, and take pull up jumpers from the right side. This information is extremely valuable and can be used to determine what offense to run, what sets to call, what drills to run in practice, etc. If you’re not on Krossover yet, schedule a demo to see what else they can do for you!


0 Comments